Revenue looked great. Profit told a different story. What we see most often in online accounts.
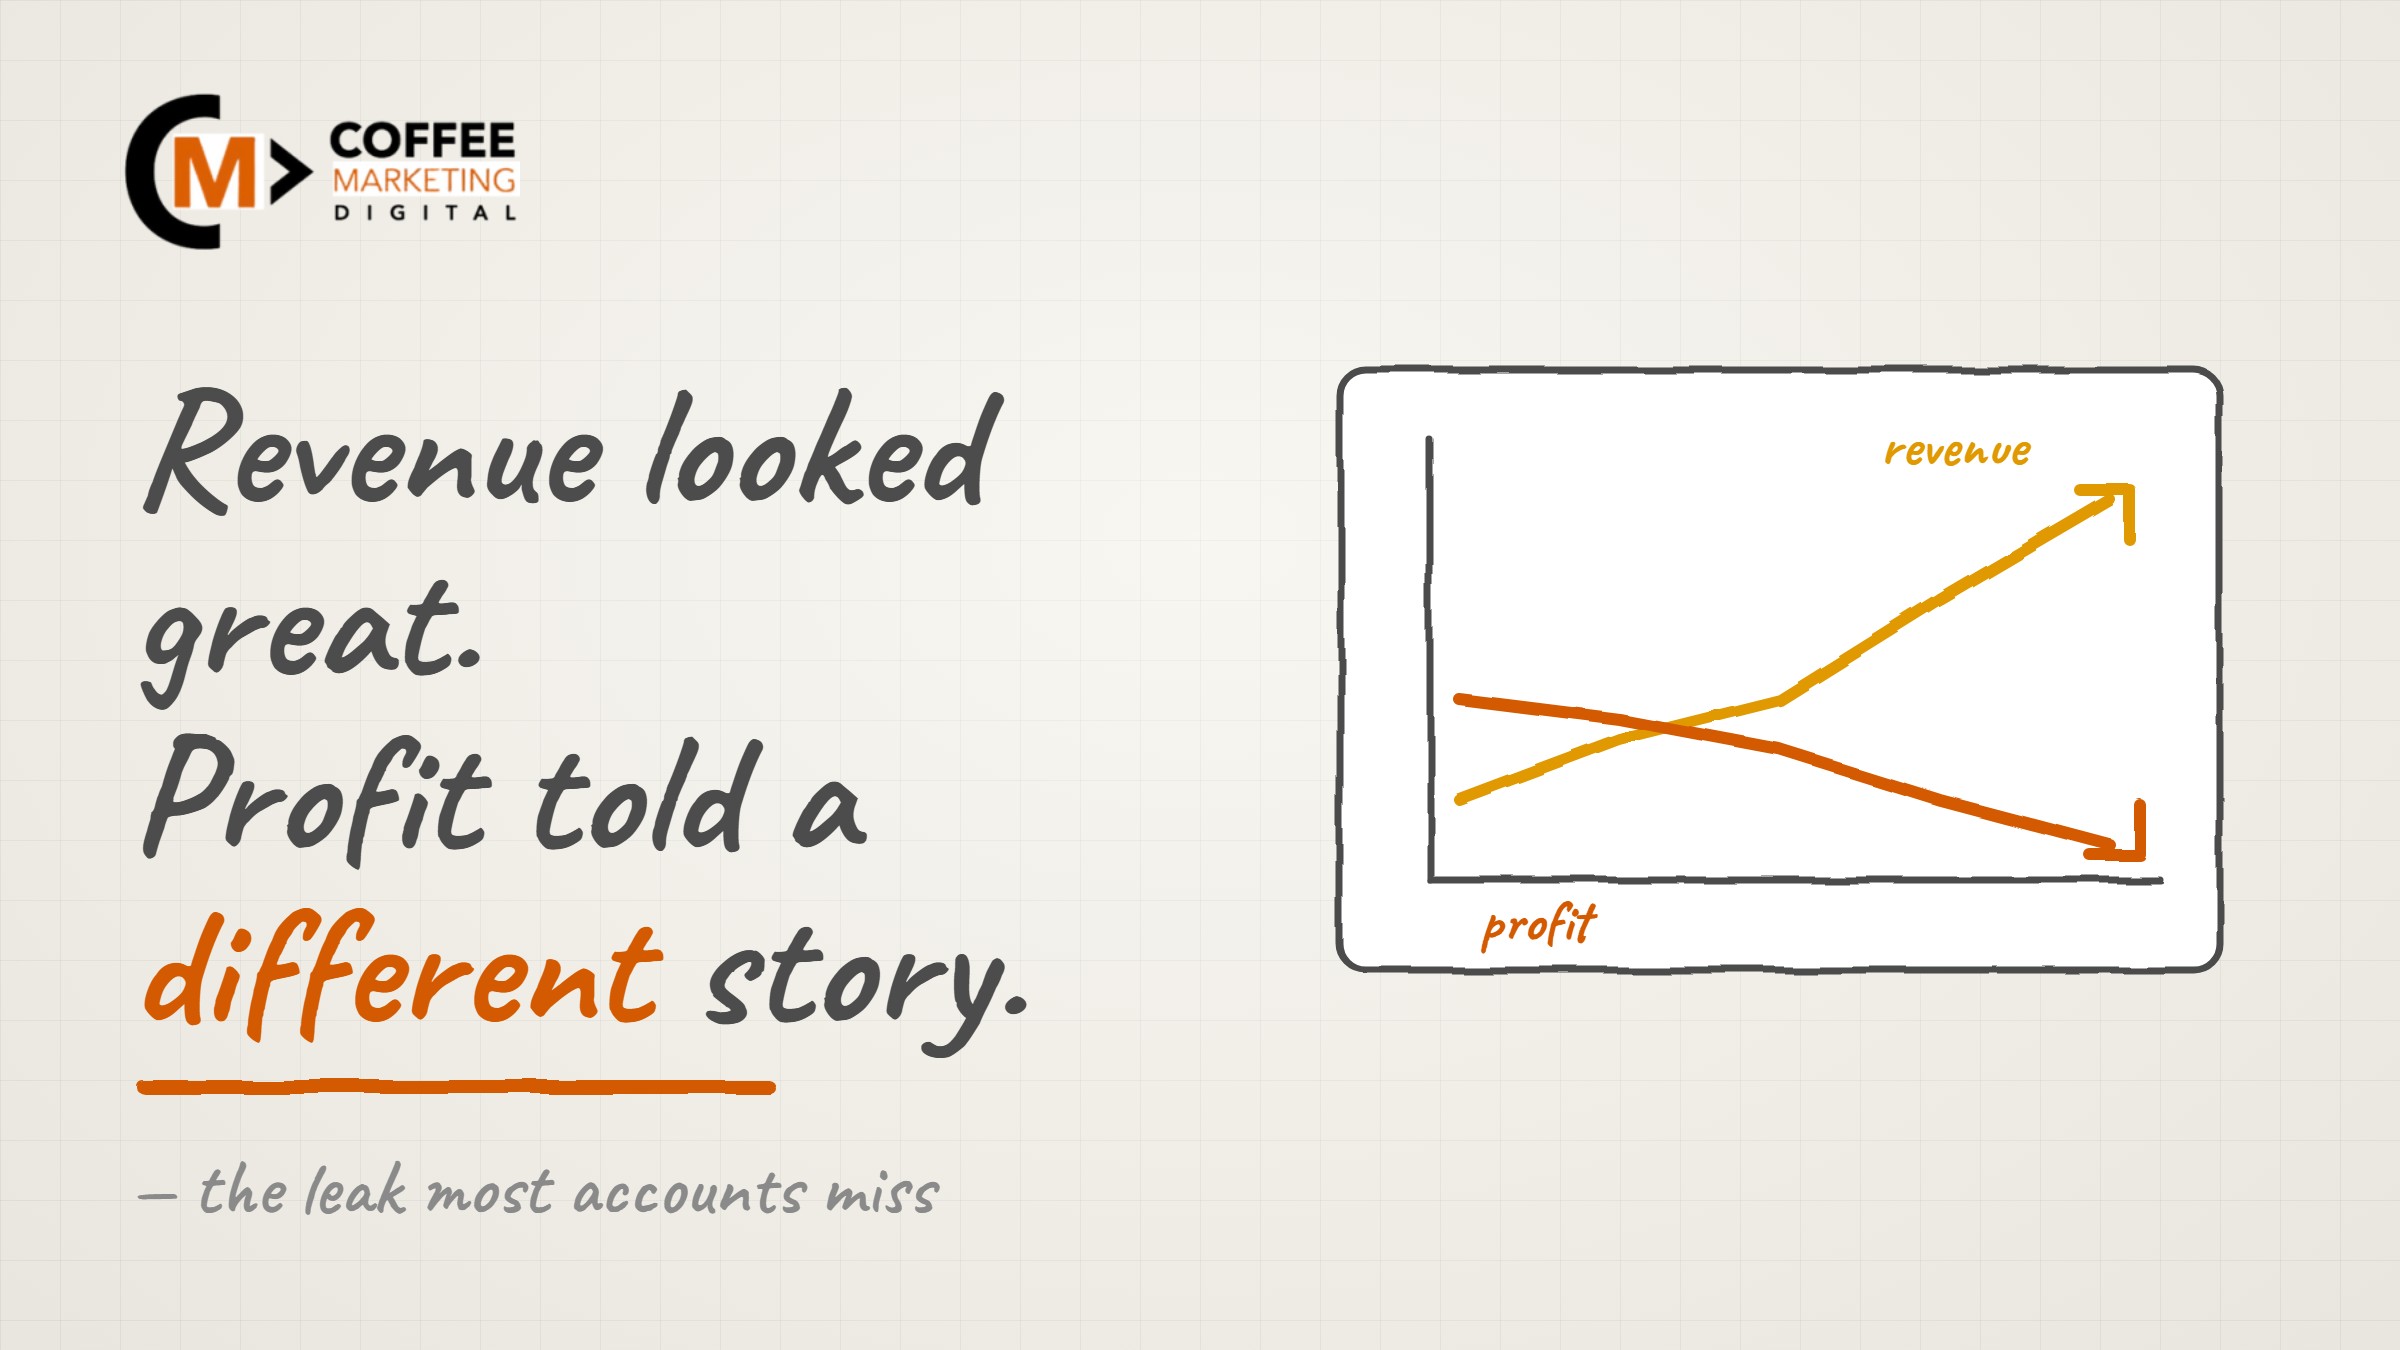
A healthy-looking revenue chart is the most comfortable place to hide a problem. We see it often. The top line grows, the ROAS holds, everyone relaxes, and underneath it the actual profit is leaking away through margin in the feed, a creeping returns rate, and one step in the funnel quietly losing money. This article walks through the pattern, without naming names, and the simple shift in what you measure that tends to surface it.
The chart that hides the problem
Most reporting is built to make revenue and ROAS the headline, because those are the numbers the ad platforms hand you for free. They are also the two numbers most likely to look fine while the business gets less profitable.
Revenue can climb because you discounted harder, sold a worse mix, or spent more to stand still. ROAS can hold steady while the margin behind each sale shrinks, because ROAS knows nothing about what a product costs you or what came back as a return. A dashboard can be green in every cell and the bank balance can still be going the wrong way. When that happens, the problem is almost never that the ads stopped working. It is that the numbers on the wall were never measuring profit in the first place.
Three places the profit usually leaks
When we look under a healthy-looking revenue chart, the same three leaks come up again and again.
Margin in the feed. If your product feed does not carry accurate cost and margin data, every automated bidding decision is being made blind to profit. The platform optimises to conversion value, cheerfully buying more of your lowest-margin sales because they look identical to your best ones. A £10 order and a £100 order signal the same thing to Google, and a high-revenue, low-margin product will quietly eat budget it should never have had.
The returns rate. Returns are the profit leak that rarely makes it back into the ad numbers. Revenue gets counted at checkout; the refund lands weeks later in a different system, and the two are never reconciled. A category with a 30% return rate can look like a hero in the ad account and be a loss-maker in the accounts. If returns are not flowing back into what you measure, you are optimising towards the products people send back.
The one funnel step on fire. There is usually a single step, one device, one page, one audience, that is dragging the whole thing down. The idea of a "metric on fire", the one underperforming point causing disproportionate damage, is a useful lens here. A slow mobile product page, a checkout field that kills conversion, a returns-heavy variant: fix that one step and the profit that was leaking through it comes back, without spending a penny more on ads.
The channel trap: judging each channel on its own
The other pattern we see is subtler, and it costs more. It is the habit of judging every marketing channel in isolation, then cutting the one with the "worst" numbers.
The trouble is that channels do not work in isolation. The brand search that converts cheaply was often created by the awareness spend that looks expensive. Cut the top-of-funnel channel because its cost per sale looks poor, and you can watch your cheap, high-converting bottom-funnel channel quietly dry up a month later, because nothing is feeding it any more. The individual channel report told you to cut exactly the thing that was doing the work.
The documented version of this pattern goes the other way too. Brands that shifted spend away from demand-harvesting channels and into demand-creating ones, judged on blended profit rather than per-channel cost per sale, have lowered their overall acquisition cost and grown new customers at the same time. The lesson is not "spend more on awareness". It is that you can only make that call correctly when you are looking at the whole picture, not one channel's isolated numbers.
The shift: measure profit, not revenue
The fix is not a new tactic. It is a change in what sits at the top of the report.
Lead with cost of sale, not ROAS. They are the same sum flipped over, so neither one knows what a product costs you. The reason to lead with cost of sale is that it lands in the same units as your margin: if your cost of sale is 20% and your gross margin is 40%, what is left is obvious at a glance. A ROAS of 5 has to be converted before it means anything next to a margin figure. Put cost of sale beside margin and the profit conversation starts on its own. From there, the changes are unglamorous and they work:
- Put real margin in the feed, so automated bidding optimises towards profit instead of revenue, and your best-margin products get the budget.
- Feed returns and refunds back into the numbers, so a category is judged on what it keeps, not what it books at checkout.
- Measure profit per order and profit per visit, not sessions and not raw conversion value, so a smaller number of better sales reads as the win it is.
- Judge channels on blended profit, looking at the whole funnel together, before you cut the channel that looks worst on its own.
“The quote, ‘there are three types of lies: lies, damn lies, and statistics’ comes to mind here. It’s easy to focus on vanity metrics such as revenue and ignore what actually matters — profitability. As you scale your marketing efforts it becomes of critical importance to provide either margins or cost of goods sold at a product-level in your feed in order to grow safely.”
— Ross Miles, Coffee Marketing
Do that, and the comfortable green dashboard turns into an honest one. Sometimes it is worse than you hoped. More often it simply points, clearly, at the one or two things actually costing you money, which is the most useful thing a report can do.
What we do, and where to start
This is the core of how we work. We look at the whole business behind the ad account, the feed, the margins, the returns, the funnel and the channel mix, not just the campaigns, because that is where profit is won or lost.
A good first step is Marketing Planning, where we map your real economics, cost of sale, margin by product type, returns and the funnel steps that matter, and turn them into a plan you can act on. Underneath it, our Analyser puts margin, cost of sale and profit at the centre of your reporting, so the number on the wall is the one that pays your wages.
You do not need to spend more to find this profit. You usually need to measure the right thing and act on what it shows. If you want a second pair of eyes on where yours is leaking, tell us the challenge.
Frequently asked questions
Why isn't ROAS enough to judge performance?
Because ROAS knows nothing about what a product costs you or what came back as a return, and neither does cost of sale, which is the same sum expressed the other way round. A steady ROAS can sit on top of shrinking margins and rising returns. What you actually kept only shows up once you bring margin and profit per order into the report.
How does margin get into the product feed?
By adding accurate cost and margin data to the feed so automated bidding can optimise towards profit, not just revenue. Most retailers do not have it in there, which is exactly why their bidding favours high-revenue, low-margin products.
We track returns in our accounts. Isn't that enough?
Not if the returns never flow back into the numbers your marketing is optimised against. If the ad account still counts the sale but not the refund, it will keep buying more of whatever gets sent back.