The Analyser
The Analyser — See Your Actual Profit, Not Just Your ROAS
The Analyser is Coffee Marketing Digital's performance intelligence platform for UK eCommerce. It connects to your Google Ads, Google Analytics 4, Google Merchant Centre and BigQuery accounts to show actual profit, breakeven points, and growth opportunities — not just clicks and ROAS.
Your Dashboards Are Lying To You.
Google Ads tells you your ROAS is 5x. Your accountant tells you margins are shrinking. Both are right. That's the problem.
Standard reporting shows revenue, not profit. It counts conversions at click time, not when money actually arrives. It ignores shipping costs, returns, and the campaigns that look brilliant on paper but bleed money in practice.
The Analyser was built because we got tired of the gap between what dashboards showed and what our clients' bank accounts said. We replaced vanity metrics with the numbers that actually matter: profit per order, breakeven ROAS, and where your next pound of growth will come from.
This isn't another reporting tool. It's performance intelligence built by people who manage real ad spend for real eCommerce businesses, every single day.
Everything You Need. Nothing You Don't.
119 intelligence modules across reporting, analysis, and optimisation. Here are the ones our clients use most.
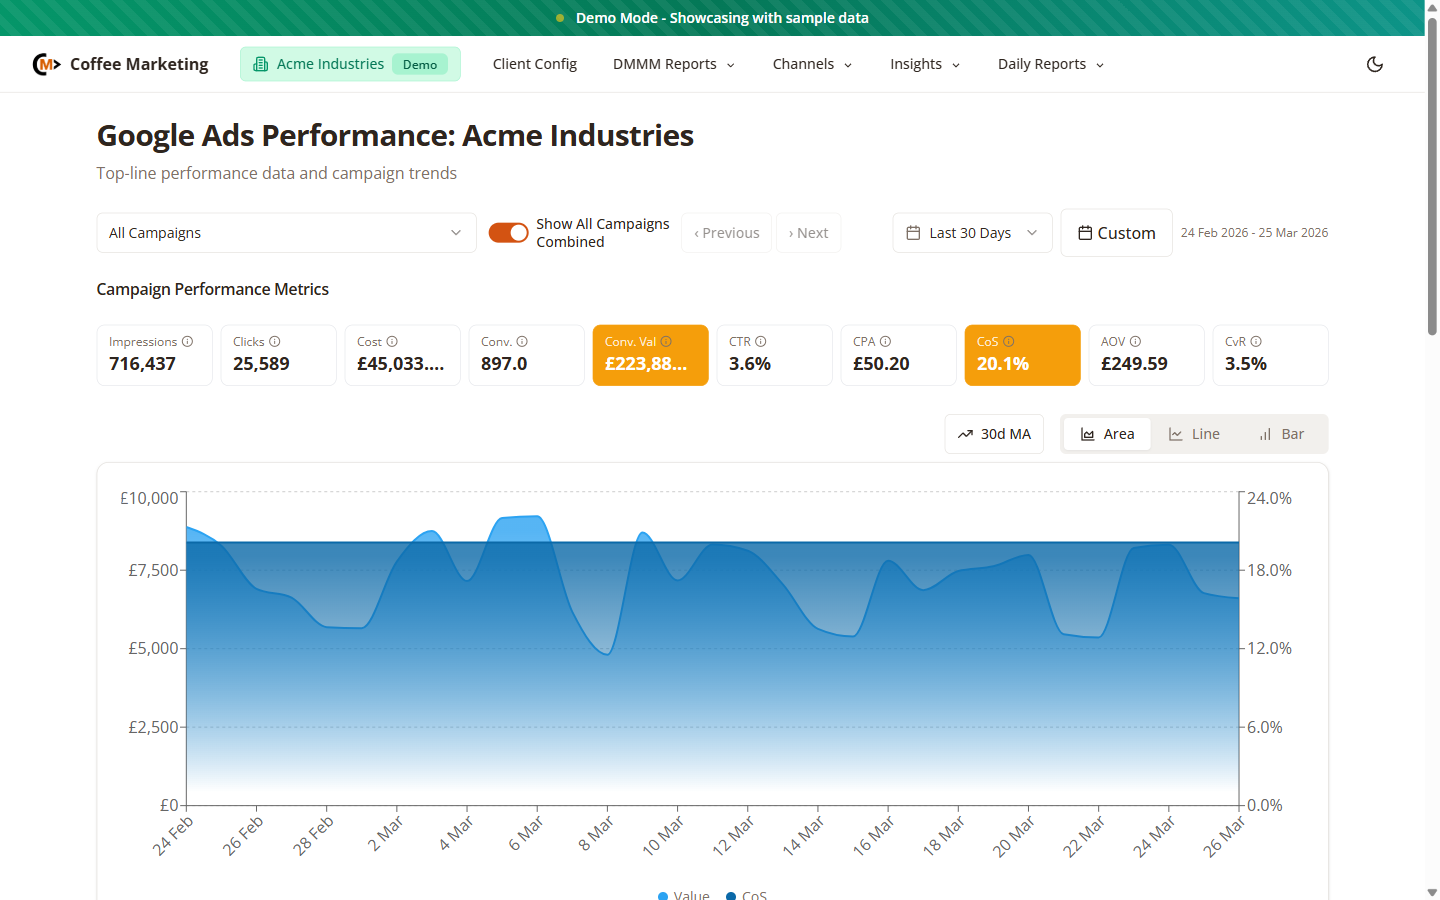
Profit Analysis
See actual profit per campaign, ad group, and product. Not revenue. Not ROAS. Real margin after costs.
Breakeven Tracking
Know exactly where profitable growth ends and wasteful spend begins. Updated daily.
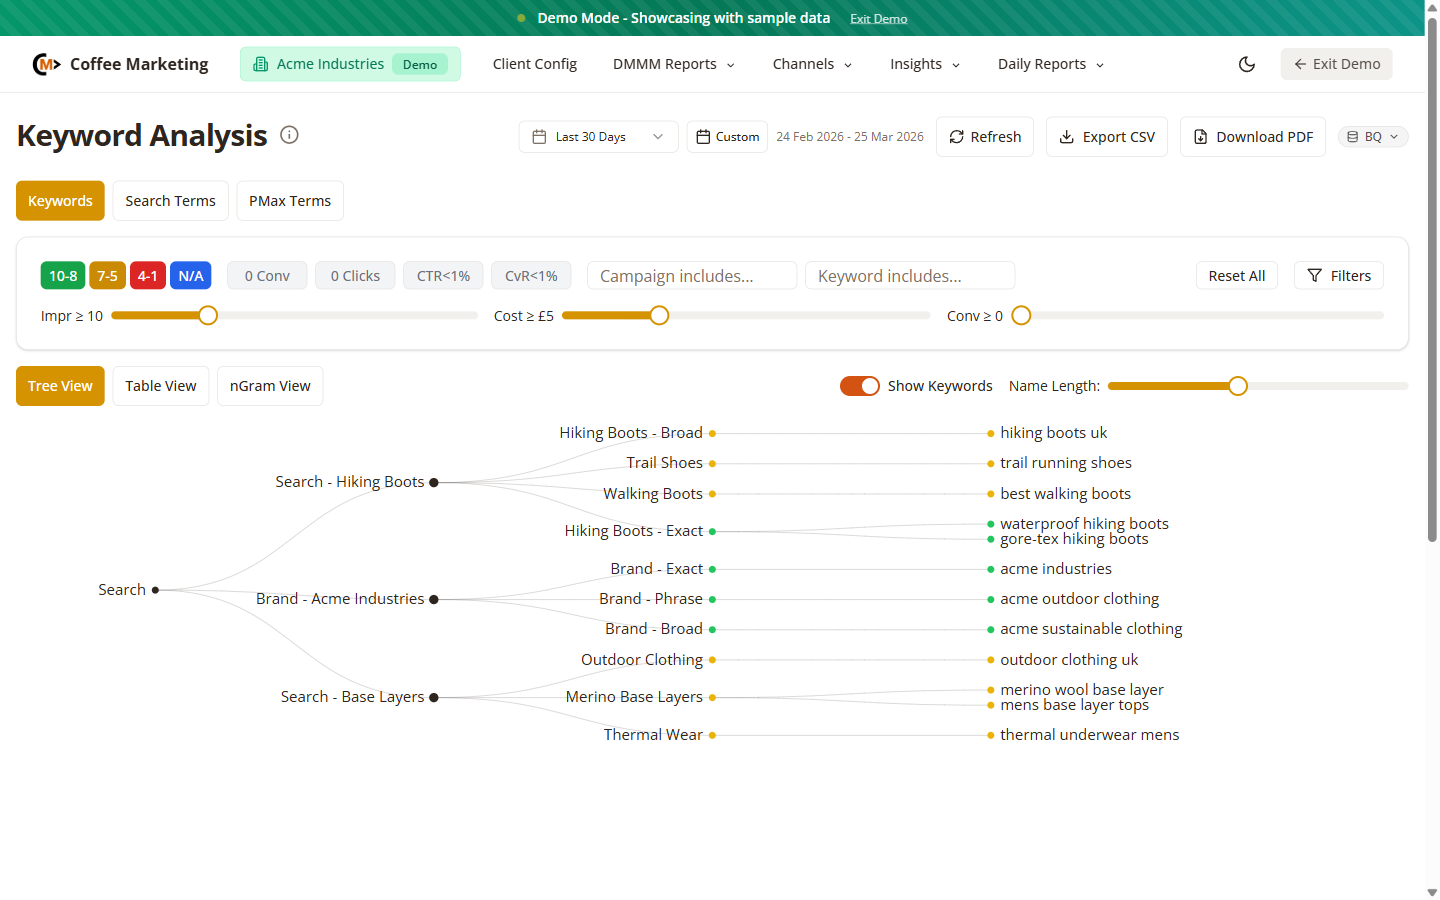
Search Term Intelligence
Intent classification, wasted spend detection, and opportunity discovery across every search query.
DMMM Framework
Our 4-stage Digital Marketing Maturity Model maps exactly where you are and what to do next.
Funnel Analysis
See-Think-Do-Care aligned funnel reporting. Understand where prospects drop off and why.
Holiday Insights
Year-on-year comparison for Black Friday, Christmas, Easter, and every peak trading period.
Weather Correlation
See how temperature, rainfall, and sunshine hours affect your sales. Plan campaigns around weather, not guesswork.
Multi-Channel Reporting
Google Ads, Microsoft Ads, Meta Ads, and GA4 in one view. Consent-rate adjusted for accuracy.
Client Portal
Branded login for your team. Explore dashboards independently, share insights, and track progress.
Brand & Category Targets
Set Cost of Sale targets by brand and category. Track performance against what actually matters to your business.
Product Performance
SKU-level analysis with profit contribution. Identify winners, cut losers, and optimise your catalogue.
Trend Analysis
180-day performance trends with conversion-time attribution. See the real picture, not the click-time distortion.
See What Your Campaigns Actually Make.
Every module was built to answer a real question our clients asked. "What's my actual profit after returns?" "Which search terms are burning money?" "How does the weather affect my sales?"
119 modules. Zero vanity metrics. One platform that tells you the truth.
How It Works
Connect
We securely connect your Google Ads, Microsoft Ads, Meta, and GA4 accounts via OAuth. Your data, your control.
Sync
Automated Cloud Functions pull your data into our BigQuery warehouse daily. 180-day lookback from day one.
Analyse
119 modules transform raw data into profit analysis, breakeven tracking, and actionable intelligence.
Grow
Make decisions based on profit, not vanity metrics. Know exactly where your next pound of growth will come from.
Built By Practitioners. Not Software Vendors.
Your Data Stays Yours
Secure OAuth connections. Your data in a dedicated BigQuery warehouse. No third-party sharing. Full GDPR compliance.
Built For eCommerce
Not a generic dashboard repurposed for retail. Every module was built solving real problems for real eCommerce businesses.
Profit-First Philosophy
We measure what matters: actual profit, breakeven points, and growth capacity. Because revenue without margin is just expensive vanity.
Choose Your Subscription.
Profit-first performance intelligence, billed monthly. Cancel anytime. All tiers include automated daily data sync, 180-day attribution, and dedicated support.
Insight
Essential Google Ads reporting
- Google Ads reporting dashboard
- Core KPI tracking (CPC, CTR, CPA, ROAS)
- Search term analysis
- Campaign performance breakdown
- Daily automated data sync
- 180-day conversion-time attribution
- Monthly performance summary
Growth
Profit intelligence for serious eCommerce
- Everything in Insight
- Profit & breakeven analysis
- Holiday insights with YoY comparison
- DMMM maturity framework
- Brand & category target tracking
- Funnel analysis (See-Think-Do-Care)
- Client portal with branded login
- Product-level performance
Performance
Full multi-channel intelligence
- Everything in Growth
- Microsoft Ads integration
- Meta Ads integration
- GA4 cross-platform reporting
- Weather correlation analysis
- Consent-rate adjusted metrics
- Trend analysis with 180-day lookback
- Priority support
Custom
Extensive customisation. Bespoke per client.
- Everything in Performance
- Bespoke module development
- Custom data source integrations
- White-label client portal
- Dedicated onboarding consultant
- Tailored reporting cadence
- SLA-backed support
- Quarterly strategy reviews
Build a Custom Plan
Tell us about your business and what you need from your performance intelligence. We'll respond within one working day with a tailored proposal.
Compare Plans
| Feature | Insight | Growth | Performance |
|---|---|---|---|
| Google Ads Reporting | ✓ | ✓ | ✓ |
| Search Term Analysis | ✓ | ✓ | ✓ |
| 180-Day Attribution | ✓ | ✓ | ✓ |
| Profit & Breakeven Analysis | — | ✓ | ✓ |
| Holiday Insights (YoY) | — | ✓ | ✓ |
| DMMM Framework | — | ✓ | ✓ |
| Client Portal | — | ✓ | ✓ |
| Product-Level Performance | — | ✓ | ✓ |
| Microsoft Ads | — | — | ✓ |
| Meta Ads | — | — | ✓ |
| GA4 Integration | — | — | ✓ |
| Weather Correlation | — | — | ✓ |
| Custom Modules | — | — | ✓ |
How The Analyser uses your Google data
The Analyser requests access to the following Google APIs to provide performance intelligence for Coffee Marketing Digital's UK eCommerce clients. All access is read-only. Data is stored in BigQuery (europe-west2) for 180 days, is never shared with third parties, sold, or used for advertising profiling, and the connection can be revoked at any time.
Google Ads — auth/adwords
We read campaign, ad group, keyword, search term, asset, product, Performance Max and cross-sell performance data daily from your Google Ads account so that the Analyser dashboard can show actual profit per campaign, breakeven points, and growth opportunities. No write operations — The Analyser never changes settings, budgets, bids or creative in your Google Ads account.
Google Analytics 4 — auth/analytics.readonly
When you connect your GA4 property via the Analyser UI, we read channel performance, key events, and audience data so that revenue can be attributed across paid and organic alongside your Google Ads data. Read-only — no GA4 configuration changes. You revoke access in the Analyser UI or via your Google Account permissions.
Google Merchant Centre — auth/content
When you connect your Google Merchant Centre account, we read product feed metadata — product IDs, titles, custom labels, and feed issues — so we can reconcile feed health with paid-media performance for Shopping and Performance Max campaigns. No write operations against the feed.
Google BigQuery — auth/bigquery.readonly + auth/cloud-platform.read-only
Optional. If you choose to connect your own BigQuery project, the Analyser runs read-only SELECT queries against the datasets you specify so we can join your first-party event data with Google Ads and GA4 for unified attribution. Results are rendered in the Analyser UI and not copied into our own BigQuery. cloud-platform.read-only is used only to enumerate the BigQuery projects available to your account during connection setup.
Privacy & revocation. Full data-handling details are in our Privacy & Cookie Policy. You can revoke any Google API connection at any time via the Analyser UI (Clients → your account → Settings → relevant connection → Disconnect) or via myaccount.google.com/permissions.
Frequently Asked Questions
What data sources does The Analyser connect to?
The Analyser connects to Google Ads, Microsoft Ads, Meta Ads, and Google Analytics 4. Data is synced automatically via secure Cloud Functions into our BigQuery data warehouse. All connections use OAuth, so your credentials are never stored by us.
How is this different from Google Ads reporting?
Google Ads shows you clicks, conversions, and ROAS. The Analyser shows you actual profit, breakeven points, and where your next pound of growth will come from. We use conversion-time attribution with a 180-day lookback for data fidelity that standard dashboards cannot match.
Can my team access the dashboards directly?
Yes. Growth and Performance plans include a branded client portal where your team can log in and explore dashboards independently, anytime. No need to wait for a report to be sent.
What is the DMMM framework?
The Digital Marketing Maturity Model is our 4-stage progression framework that tracks where your advertising capability sits today and maps the specific steps to reach the next level. It turns abstract "improvement" into measurable objectives with clear milestones.
How long does setup take?
Once you connect your accounts, our automated pipelines begin syncing data immediately. You'll have 180 days of historical data within 24 hours. Full dashboards are configured and ready within 48 hours of onboarding.
Is my data secure?
Absolutely. Your data is stored in a dedicated Google BigQuery warehouse with enterprise-grade security. We use OAuth for all connections (your passwords are never shared with us), and all data processing is fully GDPR compliant. We never share your data with third parties.
Can I switch plans later?
Yes. You can upgrade or downgrade your plan at any time. When upgrading, new features are available immediately. Your existing data and configuration are always preserved.
Do I need to be a Coffee Marketing client to use The Analyser?
The Analyser is available as a standalone subscription. You don't need to use our account management services. However, clients who combine The Analyser with our managed PPC services see the best results, because we optimise campaigns directly from the insights the platform provides.
Ready To See What Your Ads Actually Make?
Start with any plan, cancel anytime. Your data is live in 24 hours. No obligation. No sales pitch. Just profit intelligence.
Choose Your Plan